Difference between revisions of "Service monitoring"
From BrainyCP
(Новая страница: « Чтобы настроить мониторинг сервисов, перейдите в раздел админ-панели "Статистика"/"Мони…») |
m (Protected "Service monitoring" ([Edit=Allow only administrators] (indefinite) [Move=Allow only administrators] (indefinite))) |
||
| (4 intermediate revisions by one other user not shown) | |||
| Line 1: | Line 1: | ||
| − | + | <div data-placeholder="Перевод" dir="ltr" id="tw-target-text">To configure service monitoring, go to the "Statistics" / "Service monitoring" section of the admin panel.<br/> </div> <div data-placeholder="Перевод" dir="ltr" id="tw-target-text">The "Service Monitoring" section consists of two tabs "Information" and "Settings".<br/> </div> <div data-placeholder="Перевод" dir="ltr">The following settings are made on the "Information" tab:</div> <div data-placeholder="Перевод" dir="ltr">"Average load" - check the box "Show in info top" to enable display of average load data.<br/> "Services" - check the boxes next to the required items to customize the display of services. Click on the "Save" button to save your changes.<br/> "Disc space" - in the block, you can check the box "Display in the information strip" to display data on disk space, as well as view statistical information on the file system:</div> | |
| − | + | [[File:2020-12-24 12-43-25.png|border|2020-12-24 12-43-25.png]] | |
| − | + | <div data-placeholder="Перевод" dir="ltr">The following settings are made in the "Settings" tab:</div> <div data-placeholder="Перевод" dir="ltr">1. "Settings" - general settings for displaying information on the side of the user and administrator.<br/> 2. "Automatic checking" - setting of automatic check. When you have finished changing the settings, click on the "Save" button:</div> | |
| − | + | [[File:2020-12-24 12-47-10.png|border|2020-12-24 12-47-10.png]] | |
| − | |||
| − | |||
| − | |||
| − | [[File:2020- | ||
| − | |||
| − | |||
| − | |||
| − | |||
| − | |||
| − | |||
| − | |||
| − | [[File:2020- | ||
Latest revision as of 12:44, 26 July 2021
To configure service monitoring, go to the "Statistics" / "Service monitoring" section of the admin panel.
The "Service Monitoring" section consists of two tabs "Information" and "Settings".
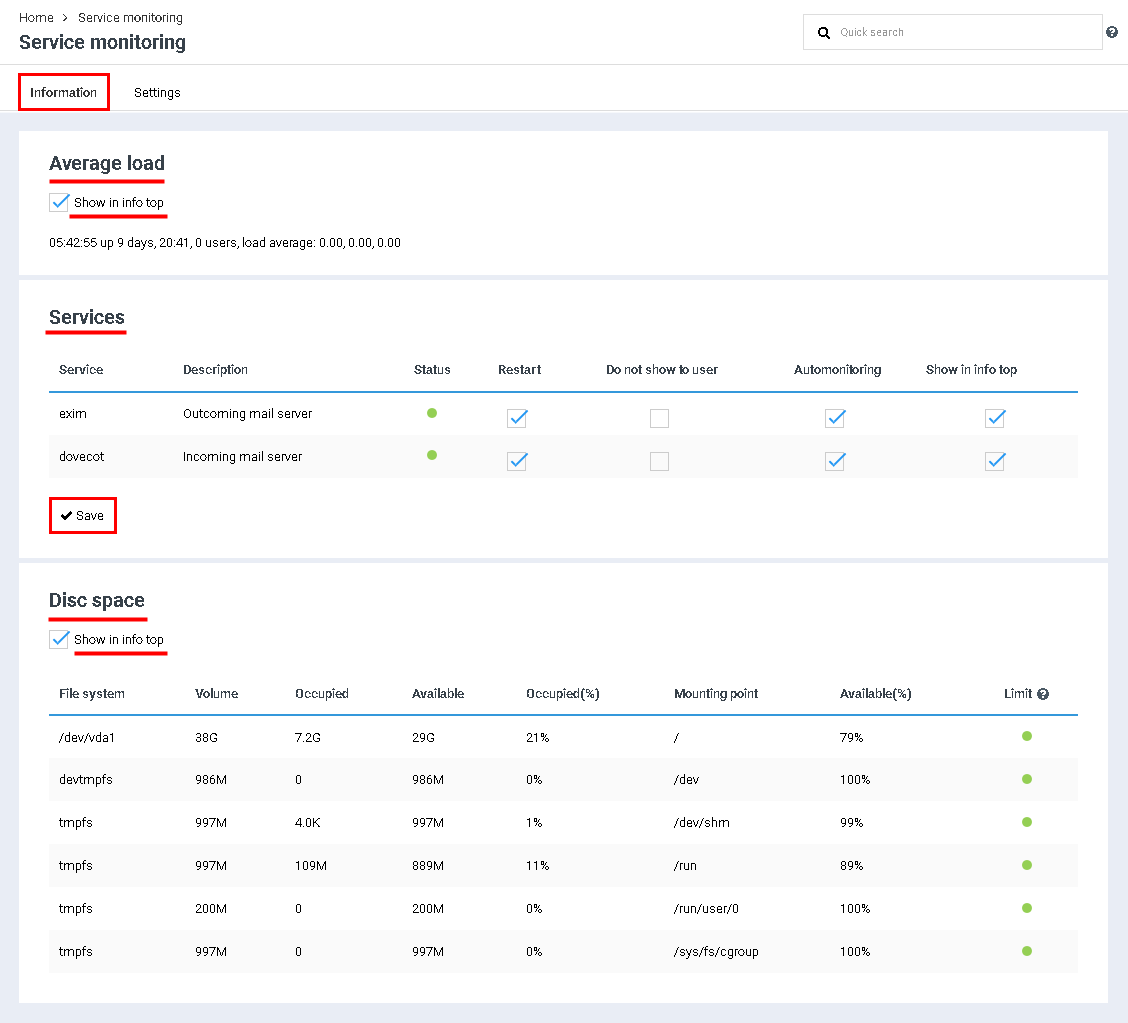
The following settings are made on the "Information" tab:
"Average load" - check the box "Show in info top" to enable display of average load data.
"Services" - check the boxes next to the required items to customize the display of services. Click on the "Save" button to save your changes.
"Disc space" - in the block, you can check the box "Display in the information strip" to display data on disk space, as well as view statistical information on the file system:
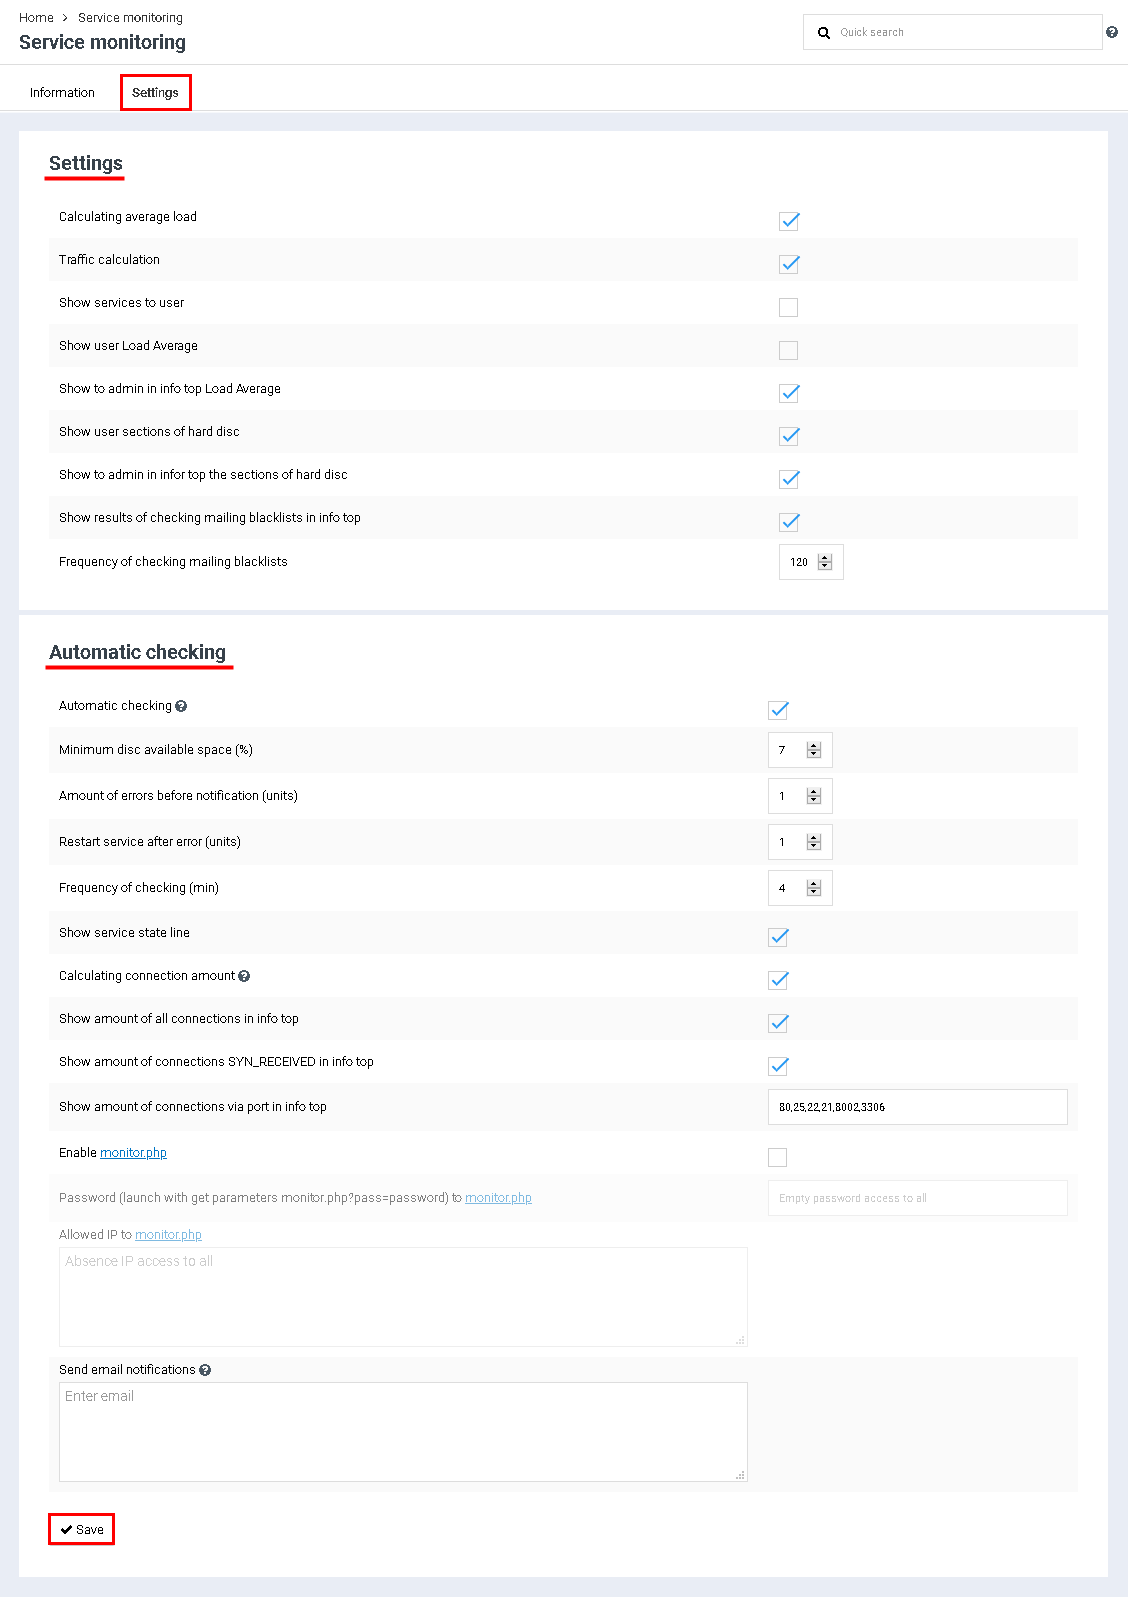
The following settings are made in the "Settings" tab:
1. "Settings" - general settings for displaying information on the side of the user and administrator.
2. "Automatic checking" - setting of automatic check. When you have finished changing the settings, click on the "Save" button:
2. "Automatic checking" - setting of automatic check. When you have finished changing the settings, click on the "Save" button:

